UNC scientists partner with citizen scientists to map Earth’s river obstructions
November 20, 2019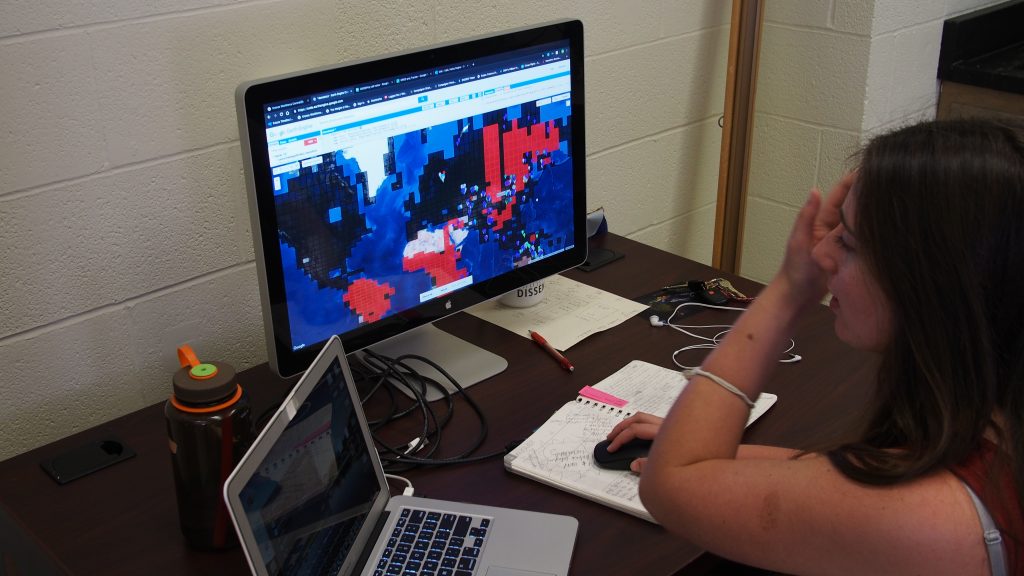
Humans have been manipulating the flow of rivers for millennia. From the earliest known dam built on the Nile by the Ancient Egyptians to modern engineering projects like the Hoover Dam, altering and controlling waterways is one of the defining characteristics of human civilization. Structures like dams, locks and levees make it possible to irrigate land for crops, transport people and goods, generate electricity and protect our homes from flooding.
Despite all of these benefits, there are a lot of reasons why disrupting the natural flow of a river can be problematic.
River obstructions can interfere with fish migration, disrupt beneficial seasonal flooding, block the movement of nutrient-rich sediments, and damage habitats.
The environment isn’t the only reason we should pay attention to river obstructions. These structures also can have a significant human and societal cost, particularly if they cause flooding that displaces a population or destroys culturally important sites.
Because of their environmental impact and economic value, you would think we would know exactly where all these river obstructions are, but the truth is our maps are incomplete. Current databases provide a good survey of large dams but miss the many small structures such as weirs and locks that still disrupt natural water flow.
“When rivers get broken up it matters a lot,” says Tamlin Pavelsky, an associate professor of global hydology who leads the Global Hydrology Lab at UNC-Chapel Hill. “These small obstructions change the velocity structure of the river, which is going to change what kinds of plants and animals can live in it,” he says. “The whole character of the river can change by putting these features in.”
So now, Pavelsky and the Global Hydrology Lab are working to build a new Global River Obstruction Database, or GROD for short, that will map all these smaller features worldwide.
By using high-resolution global satellite data, the lab aims to record a broader range of obstruction size and type for all rivers that are wider than 30 meters. That’s around a couple million kilometers of river to survey, which is more than five times the distance between the Earth and the Moon. This new database would be a first of its kind global compendium of all river obstructions, with accurate geospatial and obstruction-type information.
At first glance this seems like a nearly impossible undertaking, especially for a small group of scientists with a limited amount of time. Clearly, this is the kind of problem best solved by a sophisticated computer algorithm. But that isn’t the approach that the Global Hydrology Lab is taking. Instead, they are using a team of citizen scientists, primarily made up of UNC undergraduates, to manually map all these river features.
“Sometimes the right thing to do is to try to write a really fancy machine learning algorithm, but sometimes the right way to do things is to just have a bunch of people go and look at stuff,” jokes Pavelsky. “I’m definitely a big proponent of machine learning when it’s appropriate, it can be an incredibly powerful tool,” he adds, but points out that computers are only good at solving problems when they’re not too complicated.
This problem is particularly complicated. That’s because it takes a great deal of pattern recognition to identify different types of river obstructions from satellite images.
“Dams are really weird looking,” says Wayana Dolan, a graduate student working on the GROD project. “There’s a lot of variety in dams depending on where you are in the world in terms of structure, and not all of them cause these big reservoirs.”
“It’s important to use context clues to see what kind of dam it is and if it even is a dam,” adds UNC undergraduate Hailey Galit, who has helped map thousands of river obstructions. “There are patterns within the region that you’re looking at, like France has a ton of locks. You can use context clues and patterns to decide what’s going on in a region.”
This type visual analysis is something that humans are extremely good at.
“Our brains are just incredibly well-tuned to picking up patterns and interpreting them,” says Pavelsky. “We excel at recognizing features in all kinds of strange configurations and partial views, more so in many cases than machine learning algorithms.”
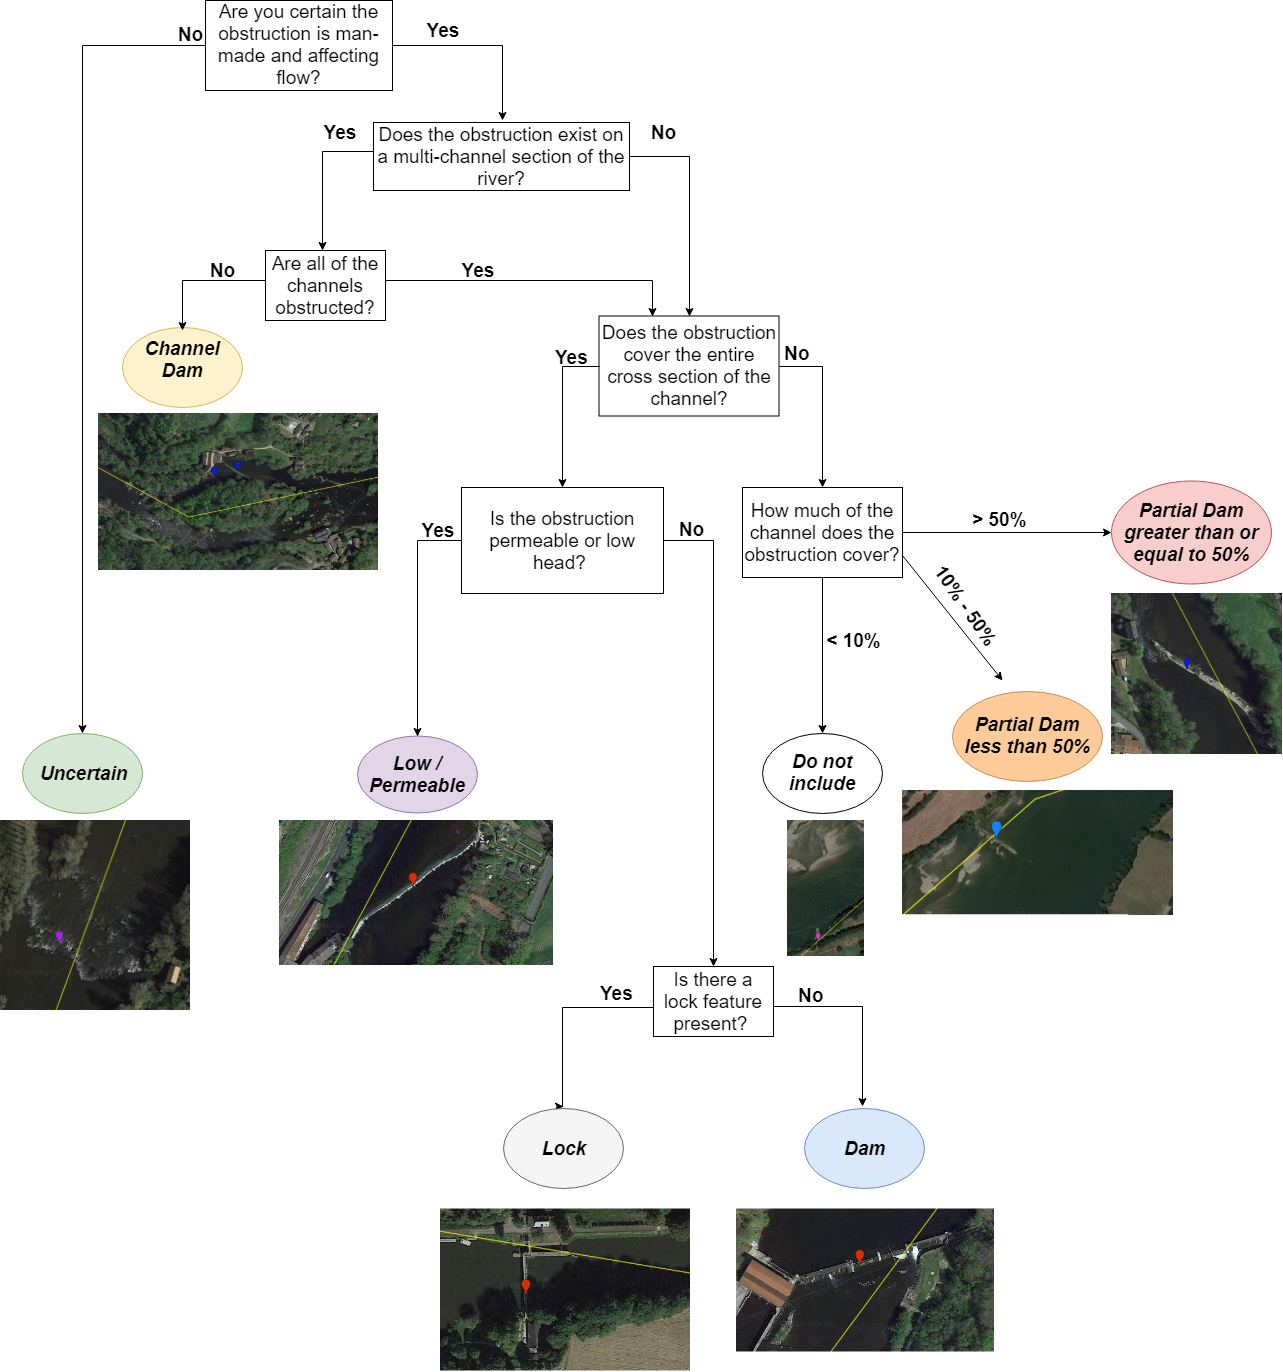
By taking advantage of Google Earth Engine, a cloud-based computing platform with an archive of satellite and geospatial data, the Global Hydrology Lab has written code that allows users to move along a river and mark obstructions as they go. Obstructions are grouped into one of five main categories: dams, locks, partial dams that don’t cross the whole river, low permeable dams, and channel dams. A detailed decision tree helps the user place each structure in the appropriate category.
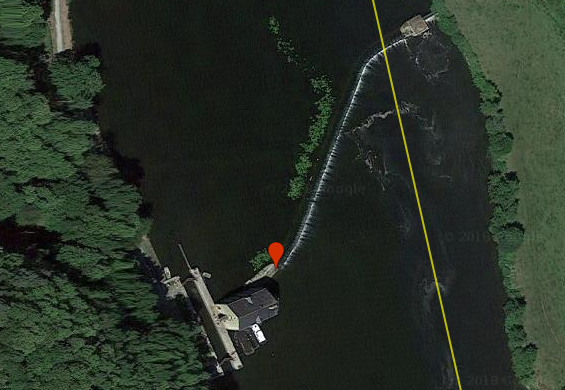
When you first run the script, you find yourself hovering thousands of feet over a river. Its path is marked on the map by a snaking yellow line. The interface is just like using Google Maps, you can zoom in and out, and freely pan along the river. When you notice something that looks like it could be an obstruction you grab the pin tool, pick the type of obstruction you want, and mark it on the map. The experience is a bit like a Where’s Waldo book, except it won’t trigger your agoraphobia. Instead you’re casually flying above a country river somewhere in France, taking a minute to appreciate a small town next to a dam. It’s not a bad way to spend thirty minutes.
But the GROD project isn’t just a digital lazy river, the resulting database will be useful for a variety of future studies. For instance, the Global Hydrology Lab is working on an upcoming NASA satellite mission that aims to measure surface water levels of rivers. In order to get accurate measurements of surface height it’s necessary to know if there are any structures in the river that will cause major differences in water level. The GROD project also may serve future efforts to design computer algorithms to analyze satellite data by providing a validated training dataset.
The decision to work with citizen scientists to map river obstructions has clearly paid off for the GROD project. As of August 2019, they have finished mapping obstructions across the whole world, documenting around 38,000 obstructions in total.
It also has been an important decision in terms of encouraging interaction between scientists and the general public.
“The barrier to being a professional scientist is pretty high, but the barrier to being a scientist is really low,” says Pavelsky. “All of us can contribute, and having that kind of interaction where we get to talk to people who are not professional scientists about the work we do, and have them participate, it gets them interested and excited and helps to build a bridge.”
If you want to learn more and even participate in the project you can visit the GROD project’s GitHub page https://globalhydrologylab.github.io/GROD/validation.
Story by Matt Niederhuber
Matt is a doctoral candidate and NSF Fellow in the Genetics and Molecular Biology Curriculum at UNC. His research is focused on understanding how genes are controlled during animal development. Matt has been writing about science stories for several years and is passionate about communicating science to the public. You can follow Matt on Twitter at @MattNiederhuber